If you know me well you know that I like numbers and graphs. You may have seen me post a lot of graphs and interpretation that I made about COVID. Here are some numbers and graphs about a more fun topic.
Every year at the beginning of December I see lots of people post their "Spotify Wrapped" on social media. It's always interesting to me to see what music other people listened to the most in the year. But for me personally, I want more than that. So this is kind of like a much nerdier and more detailed version of a Spotify Wrapped. And not just for a year, but for most of my adult life.
Since 2005, I've used the website last.fm to keep track of all the music I listen to (on a computer or iPod, at least; it can also track music you listen to on streaming services on your phone but I very rarely stream music on my phone). The popularity of Spotify Wrapped makes it clear that a lot of people enjoy being able to see stats about the music they listen to, so I recommend the website if you want more of that! If you go to my profile and scroll down, you can see my top eight artists (all time) displayed, kind of like a Spotify Wrapped:
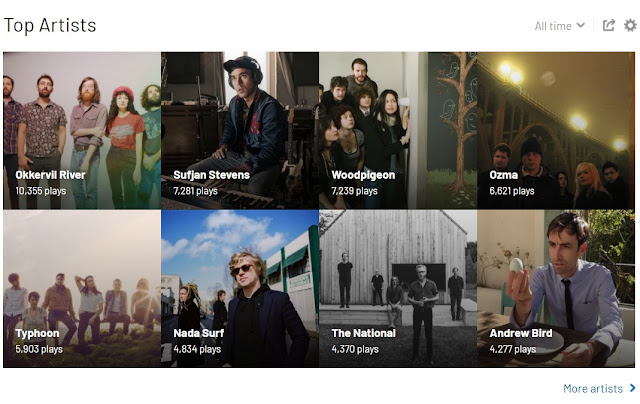
Definitely a big lead for Okkervil River in first place. If you click around you can see breakdowns by artist, by song, by album, over different periods of time. But because I'm such a data nerd, that wasn't enough for me. Luckily, a kind person made a website that exports your entire listening history as a CSV file you can download. So after doing this, I used the programming language R (running under RStudio) to play around with the data.
Here are some of the results I found interesting. Will anyone else find them interesting? Maybe? But lots of people post their Spotify Wrapped every year, so I'm going to post this.
Top artists by year
Here's a scatter plot of my top five artists for each year by year and number of plays. There's a lot of information here so apologies for the small text. Click to open and zoom in if you care to.

Observations:
-For 2005 the data only cover the last five months of the year, hence the second through fifth place artists having low numbers. Still, I listened to songs by Ozma over 1400 times. I was super obsessed with Ozma when I started using last.fm.
-Okkervil River has by far the most appearances in my yearly top five with ten. Next is Typhoon with six.
-The top seven yearly totals are all either Ozma, Okkervil River, or Woodpigeon.
-The highest yearly totals are all in the earlier years. In more recent years my music listening has become more spread out over a larger number of artists.
-The Weather Station in 2021 recorded my highest yearly total for one artist in nearly ten years.
Top single months for artists
These are the top fifteen totals recorded by artists for single months:

Woodpigeon comes in with three of the top five. Like Ozma, I was also super obsessed with Woodpigeon for a time. I like the story of how I discovered Woodpigeon. When Cara and I saw A Northern Chorus's farewell show in Hamilton, Ontario, in 2008, the next day we went to a music store there and each picked out one used CD to buy (knowing nothing about the music except for what we could see in the artwork and liner notes; it was a thing we often enjoyed doing). Woodpigeon's Songbook was Cara's pick. If you're an indie pop fan, I highly recommend checking out that album and even more so their subsequent album Treasury Library Canada. Sadly, Woodpigeon is the only artist in my top twenty overall artists that I've never seen live.
The way that my music has become more spread out over a larger number of artists and less concentrated on single artists is also evident here as the National's October 2019 tally is the only one on this list more recent than 2013.
Looking at this list, it's fun to think back on what was happening in my life and why I was listening to those particular bands so much in those years and months. Which is a good segue into...
I listen to an awful lot of Sufjan Stevens in December
Sufjan Stevens came in fourth on the above list with his December 2012 tally. That was the month after the release of his second five-disc box set of Christmas music. Yes, he has released ten discs' worth of Christmas music (a mix of traditional and original songs). And I love all of it. To me, Sufjan Stevens' music basically is the Christmas season. December 2012 was also when Cara and I saw Sufjan's spectacular Christmas show at the Beachland Ballroom. Definitely one of the best shows I've ever attended. So December 2012 stands out the most, but every single December, I'm putting all that Sufjan Christmas music in heavy rotation. And so if you take each of my top nine artists overall and sum up how much I've listened to them by month of the year for the entire 2005-2021 period, you get this:

There's one month for one artist that is a really huge outlier here! Everything else is fairly random, although I enjoy the nice oscillatory pattern on the Okkervil River graph.
Now let's move on to...
My music listening habits by geography (or, I listen to a lot of music from Canada)
I took every artist for whom I've recorded at least 100 total plays and manually annotated their nations of origin (as well as state or province for American and Canadian bands). First, here's a graph showing all the nations that appeared in my history, with the total number of listens for each:

The USA has the most by far, which is obviously not surprising. But the USA also has a much larger population than any of the other countries on here. What happens if we adjust the numbers to make them a ratio of the number of plays to the national population? Then we get this:

Canada surges into the lead! Interestingly, Iceland is second. Iceland's population of 366,000 is slightly smaller than the city proper population of Cleveland, Ohio. The USA is now third. I've noticed for quite a while that there's a disproportionate amount of music that I listen to from Canada considering how much smaller a population it has than the US. There's just something about those Canadians, man.
And here's a similar analysis but in list form for the top states and provinces of my music listening history. First ranked by raw number of plays:

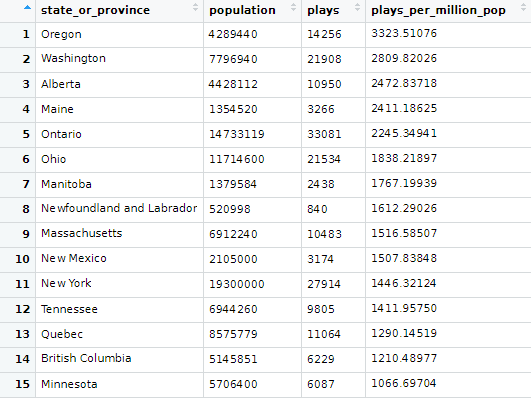
I think the fact that the top eight states and provinces on this list consist of four Canadian provinces along with the states of Oregon, Washington, Maine, and Ohio is easily the most "on brand" thing for me in this post.
And last, what I consider by far the most interesting result from the analysis I did:
Trends in my music listening by vocalist gender
Similar to the geographical annotation, I also manually annotated by lead vocals: male, female, both, or none (none meaning music without vocals or with extremely minimal vocals). I didn't really have strictly defined criteria for the categorization but just went with what felt right, so Arcade Fire counted as "male" because Win Butler does lead on a large majority of the songs with just the occasional Régine Chassagne song, whereas the New Pornographers counted as "both" because even though most of the songs do have male lead vocals, there are a substantial number of songs throughout their catalog with Neko Case or occasionally another female vocalist taking lead.
I then excluded the "both" and "none" artists (a small fraction of the total), calculated the fraction of what remained that fell under "male" vs. "female" for each year, and got this graph:

It's just such a striking trend! When I first started using last.fm in 2005, I listened to almost no music with female lead vocals. This had been true for as long as I listened to mostly music of my own choosing, going back to adolescence. 2005 was when I first started to really expand my taste in music. And going forward, there was a steady increase in how much music with female lead vocals I listened to. Finally, in 2020 and 2021, I reached very close to a 50/50 balance. It's just such an interesting trend to me. If you're a stats nerd, you might appreciate that a linear regression of fraction (either female or male) against year has a whopping 0.86 R-squared value (p = 5.1 x 10^-8).
I think it says something about how boys are socialized to avoid "girly" things. I don't remember ever having an active dislike for music with female vocals. But I still tended not to choose to listen to it. Then, as an adult, as I explored more and more music, and started to just listen to whatever I enjoyed listening to, this eventually led to a near perfect balance of vocals by gender. Funny how that worked out.
So that includes my super nerdy analysis of my music listening history. I hope someone else found it entertaining, but at the very least I did! It's a more cheery topic for graphs than how many people have died from COVID, so at least there's that.